Would you like to know more about Event Technology?
Contact us now for more information.
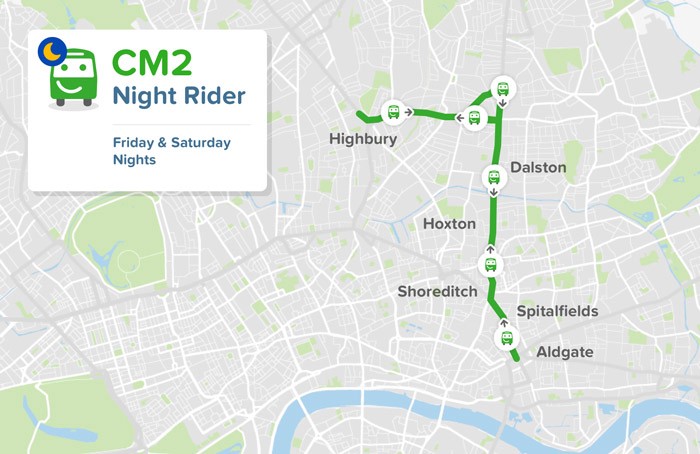
There’s an app called CityMapper that helps me get around London. It tells me the best route, which carriage to take on the tube to be nearest the right exit at my destination, and my time to arrival. It’s very handy. So when they recently announced they were launching a real bus service in London, I was intrigued.
Why would an app company launch a bus service when Transport for London (TfL) surely has it all covered? What do they know that TfL doesn’t?
Well, they looked at the data; at a lot of data. They looked at all the routes travelled by their users: when, where, how and how long, and they noticed something. They noticed a journey that users were trying to make that wasn’t being served by TfL.

So, they simply bought some buses, got a licence and set up a route. Only time will tell whether it’s a success or not, but what they have done has lessons for all of us who organise and run events.

Well, event technology generates data about our delegates’ activity. This information ought to be looked at so we can improve our events. But what sort of thing could we look for?
CityMapper looked at their users’ journeys and I suggest we do the same at our events. Here are some things we might be able to learn.
Let’s say you have sessions in several rooms, one after the other. If you look at which sessions people went to, you might find that a large proportion of attendees in Session C came from Sessions A and B. What if you were to organise the rooms for these sessions accordingly? Wouldn’t that potentially reduce times between sessions and improve overall attendance?
What might you discover if you looked at the times people arrived at each session? If there is a spike of arrivals just after a session starts, have a look to see why that might be.
What about looking to see if there was a correlation between the time delegates arrive at breakfast and when they arrive at their first session?
What about looking at which exhibition stands your delegates visited? What order did they do it in? Could that help you suggest where your exhibitors ought to have their stand at the next exhibition? Where are the most transited areas? And the least?
Which sessions and topics received the most questions and comments? Which documents were the most requested? Is there a link between the two? How about providing a personalised newsletter to each of your delegates containing more information on topics they are most interested in? Or conversely, how about adding a couple that challenge them to think outside their ‘bubble’?
As you can see, this isn’t about spying on delegates’ movements; it’s about trying to understand how to improve the event, and not only the logistics, but also the content.
And who knows, you might end up getting so many more delegates at your next event that you too have to lay on a few extra buses…